

Crop monitoring and fertilization control
Decisions that can pay back your investment in the first season
ScanSpectrum is a tool for decisions about fertilization, irrigation, and harvest timing — the parameters that directly affect production cost and field results.
Ready-made calibration models
Four crops with nitrogen and dry-matter models — built on 4 years of field trials — already working today!
Ask about your crop →%20in%20Germany.JPG?width=1000) Nitrogen status
Nitrogen statusRapeseed
Assessing post-winter condition and N status before the spring dose, when differences between field zones are greatest.
 Excess-N control
Barley
Checking for excessive nitrogen status — especially important in malting barley.
 Top-dressing dose
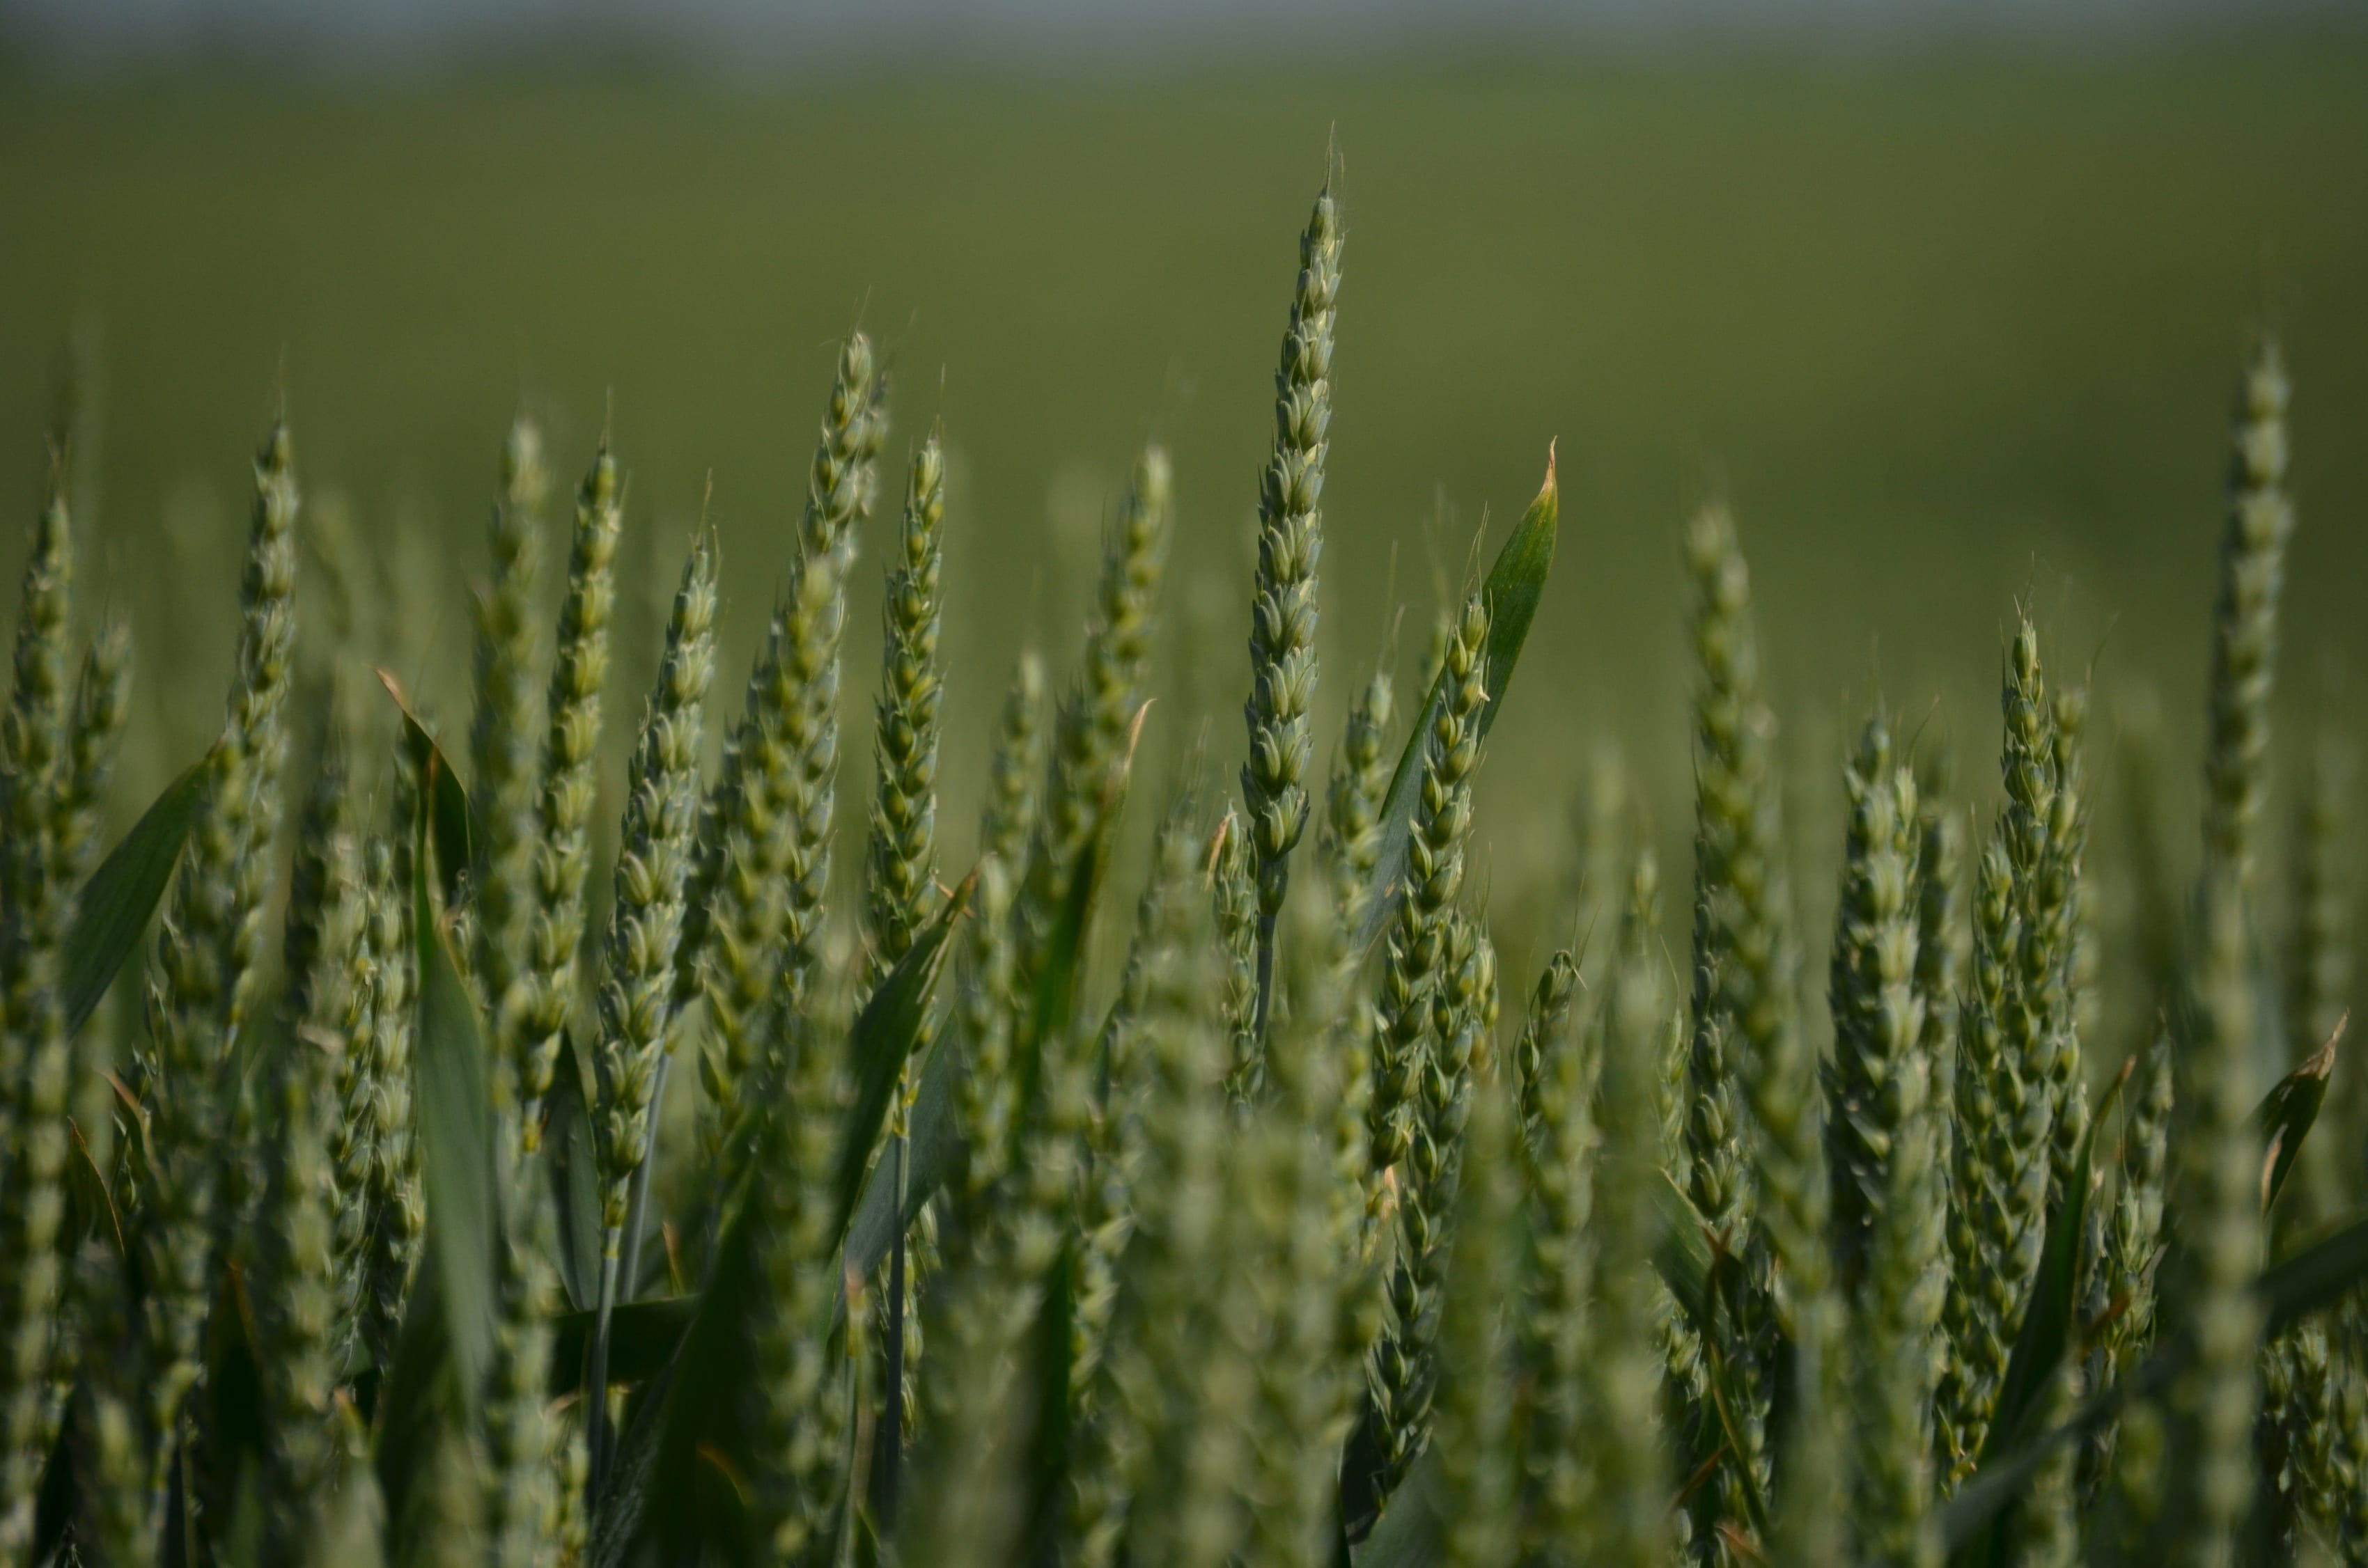
Wheat
NDRE stays sensitive even in a dense canopy, so you can plan the top-dressing dose separately for each zone.
 Dry matter
Corn
The dry-matter model points to the right silage-harvest date, when the window between “too wet” and “too dry” lasts about a week.
A single leaf measurement delivers a range of information about the plant
Vegetation indices that reveal plant stress, plus AI models that determine nitrogen and moisture from the full spectrum.
Plant vigor
Shows the plant’s overall condition and activity. Helps quickly spot differences between plants and field zones.
Condition in a developed canopy
Uses the red-edge range, which lets you observe differences even when vegetation is already dense and well developed.
Water status
Reports on the plant’s water balance and lets you observe changes linked to water stress.
Chlorophyll
An index tied to chlorophyll content in the leaf. Lets you monitor differences in coloring and plant condition.
Nitrogen
Estimating N contentThis isn’t an index but the output of a model that analyzes the plant’s entire spectrum. It lets you estimate nitrogen content without sending a sample to the lab every time.
Dry matter
Estimating dry-matter contentAlso a model output, not an index. Shows how close the plant is to harvest maturity — without drying and without waiting for lab results.
of farms will recover the device’s cost after just one season*
The savings come from fertilization alone: a dose matched to field zones instead of one flat rate for the whole area.
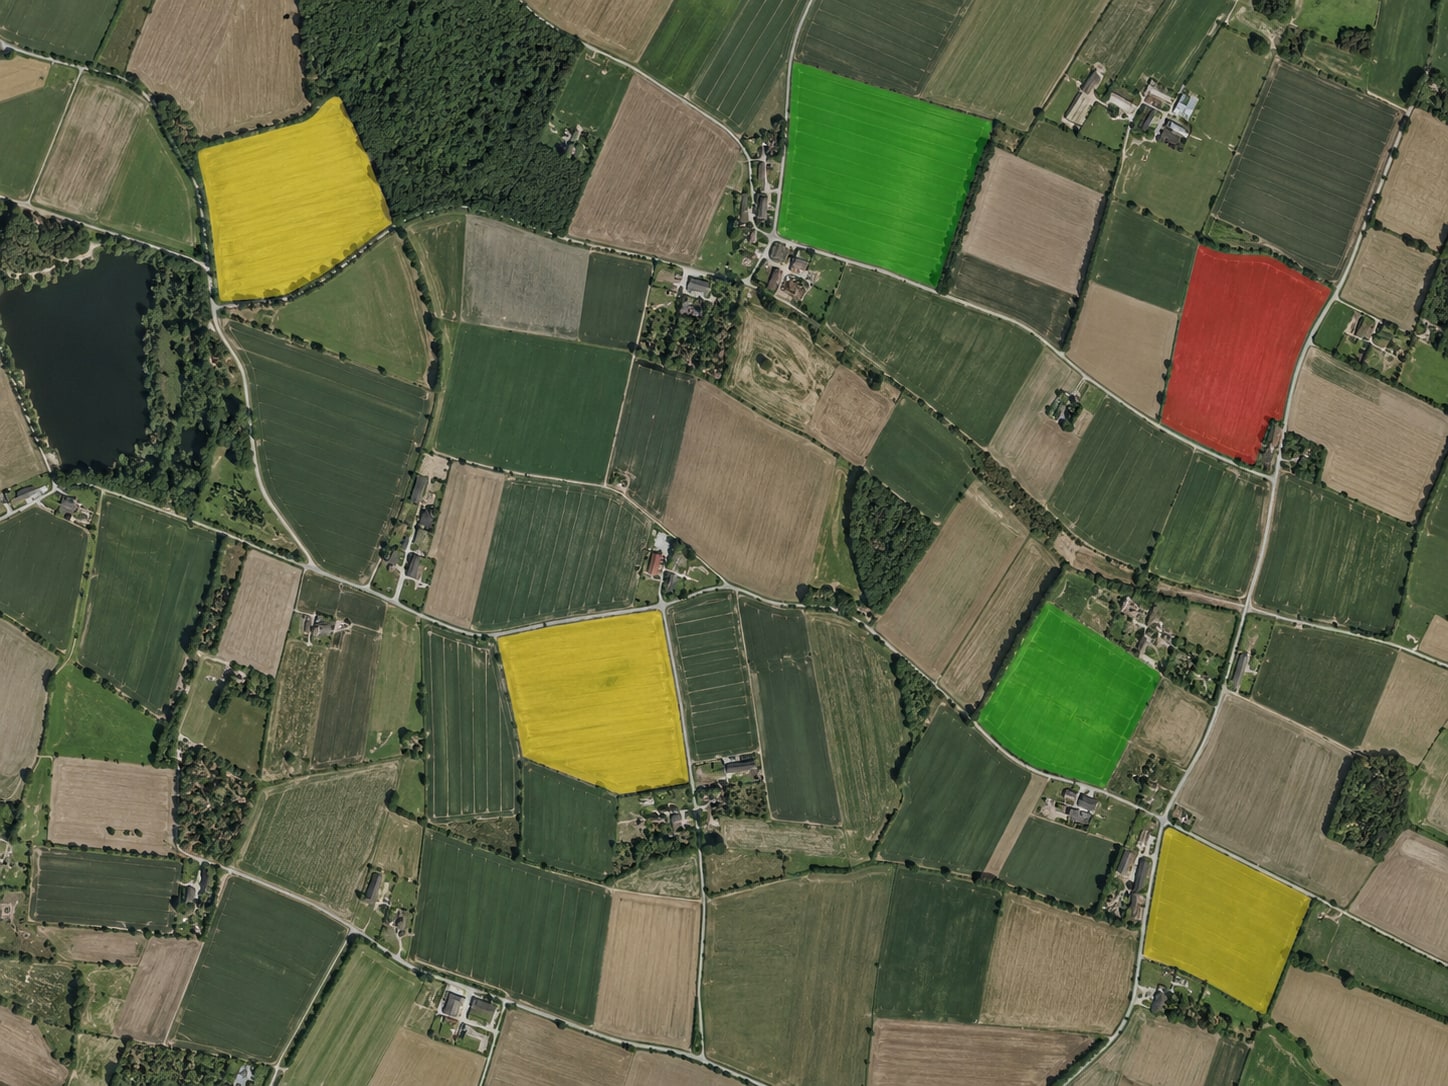
The right dose. The right zone. The right moment.
Measure the plants, then build variable-rate fertilization maps. Instead of applying one dose across the whole field, match fertilization to the plants’ real needs.
Highest yield potential and lowest N status — this is where the dose goes up.
*Based on farmers’ own statements about the fertilization they apply.
**Indicative values from internal pilots. Results depend on prior practice, crop, and weather.
Integrations
coming soonApps that work together with ScanSpectrum