Scan Analyze Decide
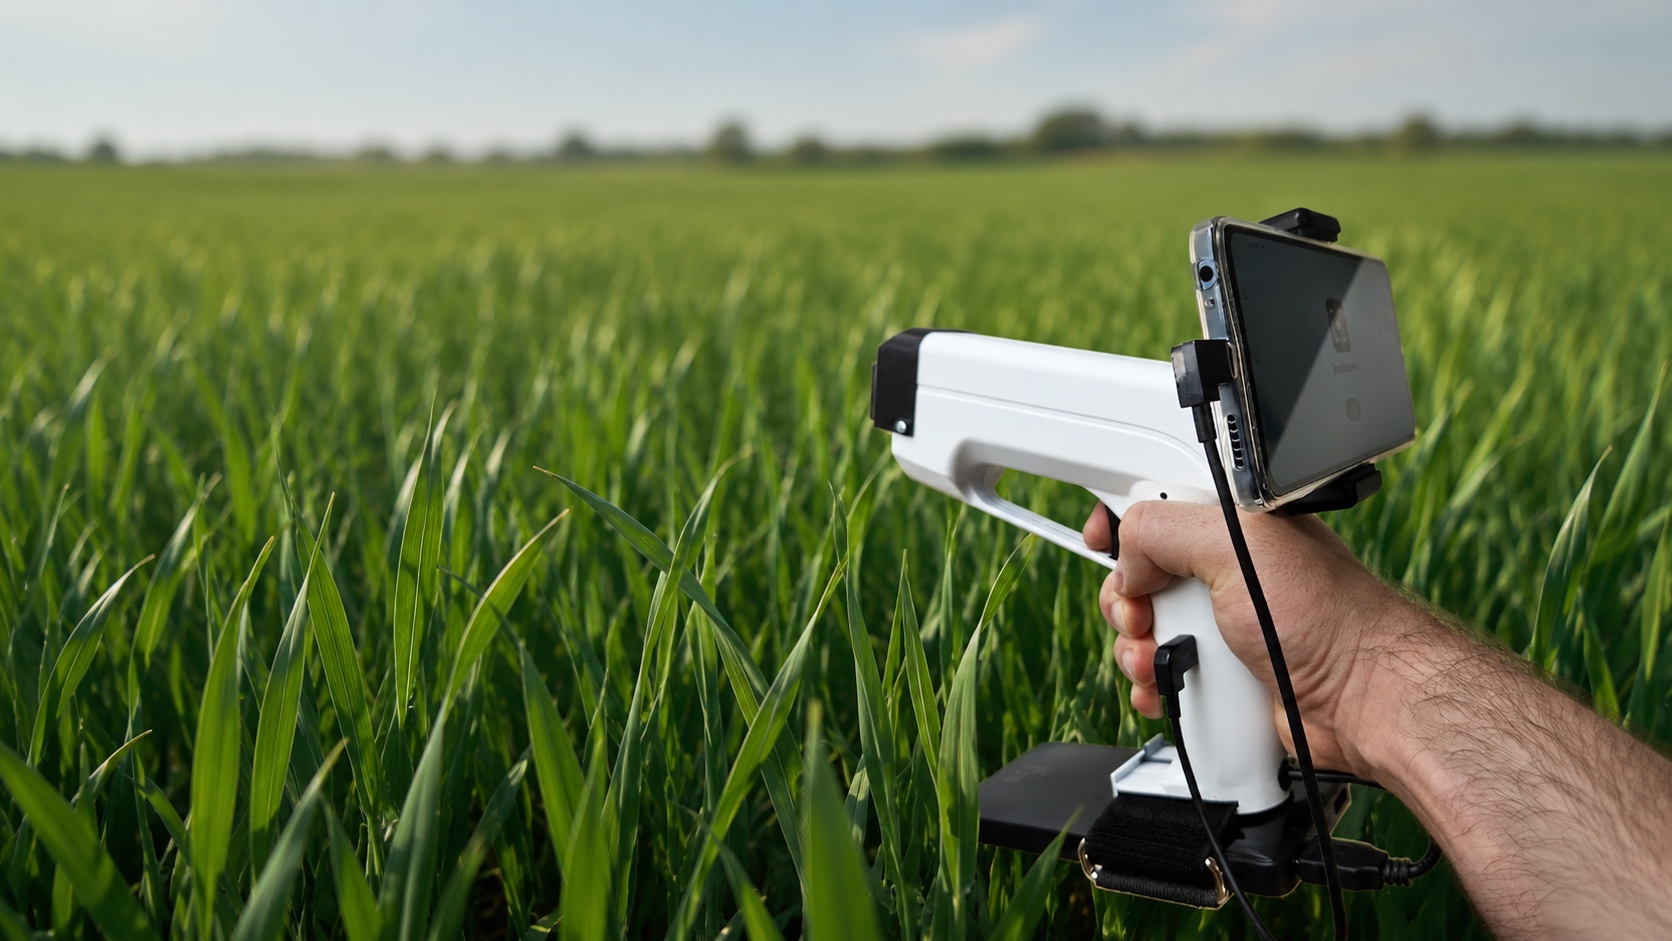
ScanSpectrum is a portable VIS–NIR spectrophotometer built for work in the field and in the lab alike. It lets you quickly collect spectral data from plants, soil, food, and other materials, supporting the development of calibration models and data-driven decisions.
Turn signals from materials into practical information
ScanSpectrum records the spectral signal of a material. A properly prepared analytical model turns the spectrum into a result matched to the specific application.
Application Areas
Agriculture
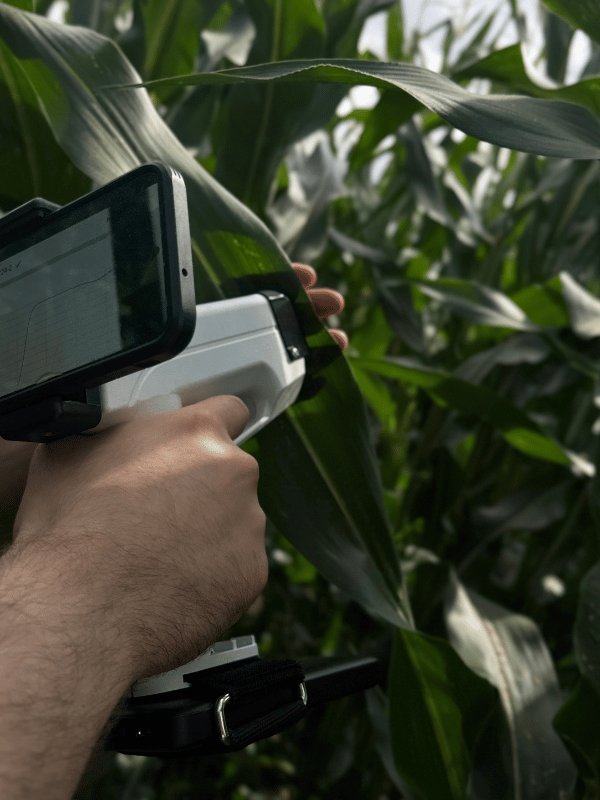
Analyze plant condition, nutrient content, water stress, moisture, and vegetation indices directly in the field.
See applications →Food & Raw Materials
Assess the quality, composition, and authenticity of food products, oils, flours, and other materials.
See applications →Science & R&D
Collect raw spectral data, export results, and build your own models and reference libraries.
See applications →What’s hidden in the 400–1100 nm spectrum
Drag the marker across the measurement range or click a segment to see which sample properties are tied to that part of the spectrum.
Red edge
A sharp transition from strong chlorophyll absorption to high infrared reflectance. The position of this edge shifts with nitrogen supply and is the most sensitive indicator of early stress.
From light to practical information
Every material absorbs and reflects light differently. ScanSpectrum records those differences as a spectrum — a unique fingerprint of the sample’s properties.
Scan the sample
Hold the device against the material being tested, or place the sample in a cuvette.
Take the measurement
ScanSpectrum measures the 400–1100 nm range, recording 2,801 spectral points.
Read the result
The AI model analyzes the spectrum and shows the result directly in the mobile app.
Where ScanSpectrum is used
Let’s talk about your application
Describe the material you want to test and the parameter you care about. We’ll tell you whether — and how — ScanSpectrum can measure it.
Frequently asked questions
What spectral range does ScanSpectrum cover?+
The device operates in the VIS-NIR 400–1100 nm range and records 2,801 spectral points per measurement. This is the range where chlorophyll content, water, and a wide group of organic compounds are best seen.
How long does one measurement take?+
About 3 seconds — from placing the device to seeing the result in the app. Further measurements can be taken back to back, point by point.
Do I need a laboratory?+
No. ScanSpectrum is portable and powered by a power bank, so you take the measurement directly in the field, in a warehouse, or on a production line.
Where do the analytical models come from?+
A model is built from a set of spectra linked to reference results for a given material and parameter. We provide ready-made models for typical applications, and build new ones together with the client.
What are the three measurement modes?+
Reflectance mode for leaves and surfaces, transmittance mode for liquids and light-transmitting materials, and fluorescence mode for samples that emit light after excitation.
Can I export the raw data?+
Yes. Every measurement can be exported as a full spectrum with metadata, letting you build your own reference libraries and models.